- Original research article
- Open access
- Published:
Assessing lower track students’ learning in science inference skills in Singapore
Asia-Pacific Science Education volume 5, Article number: 5 (2019)
Abstract
It is a generally held view amongst educators today that the development of students’ inference skills is an important aspect in their education as 21st Century learners as it requires higher order cognitive competences. Oftentimes, students in the lower tracks are considered slower learners and may have difficulties with the development of such skills. There is, however, limited empirical evidence to support such claims. As a result, there is a lack of understanding how such skills are taught, and how lower track students acquire them. The purpose of this study is to investigate lower track students’ science inference skills over one academic year, to better understand their learning and development. To determine this, three multiple-choice science inference skills tests were developed based on science syllabus and administered over a 9-month period. In total, 1397 Grade 7 lower track (i.e., Normal Academic) students from 38 Singapore secondary schools participated in the study. The students’ performances were determined through three equated tests using Rasch common-item procedures. The results showed that students experienced greater difficulty with tests over time. They particularly had difficulties with questions pertinent to graphs, tables, diagrams, or charts, or required them to extend their thinking beyond the given information. They also had difficulty in deducing answers using the elimination technique, and items that involved experiments and variables. Items that involved pattern recognition, concluding using range, application of a given concept, and limited information were easier for them. The findings also have implications for science teacher education in terms of assessment literacy, and the science teaching of lower track students.
Introduction
In the last two decades, there is greater emphasis on developing diverse learners holistically and equipping them with 21st Century Competencies (21CC). These include: (1) cognitive competencies (e.g., the mastery of core subject contents taught, creative thinking, inference skills and problem solving), (2) interpersonal competencies (e.g., communication skills, leadership skills and social skills); and (3) intrapersonal competencies (e.g., self-directed learning, life-long learning and attitudes towards learning) (Soland, Hamilton, & Stecher, 2013). Educators, have over time, developed many innovative ways to determine students’ learning and development in 21CC, which may include making observations in a naturalistic setting, project works, student portfolios and soliciting student feedback on learning (Griffin & Care, 2015; Ratcliffe, 1999). However, cognitive testing is still the most widely applied form of assessment to understanding student learning in schools—that is, the assessment of students’ cognitive development. While this may be true, there is a shift from testing students’ recall of core academic contents taught in the classroom to the mastery of higher-order thinking skills, such as critical thinking, inference skills and lateral thinking skills. These new emphases could enable educators to understand and contribute positively to the development of knowledge, skills and dispositions for student learning beyond the classroom (Bachen, Hernández-Ramos, & Raphael, 2012; Black & Wiliam, 1998; Boud & Falchikov, 2006; Koenig, 2011; Shepard et al., 2005; Soland et al., 2013 Stiggins, 2002).
In this paper, we discuss the findings of lower track students’ performances on three science inference skills test equated through Rasch common-item test equating procedures. The word “inference” refers to the skill needed to decipher information and use it to make sense or meaning in other contexts. Similarly, science inference skills refer to skills that scientists use in carrying out their investigations (National Research Council, 1996, 2011), and require higher-order thinking skills related to 21CC (Conklin & Williams, 2011). Using Rasch test-equating procedures, we investigated how the lower track students’ science inference abilities changed over one academic year to infer the emphasis of such skills in classroom teaching. Through more in-depth analysis of students’ performance in answering the science inference items, we could infer the types of science inference items that are more or less challenging for students. These insights would be useful for teaching and learning practices, including assessment and teaching pedagogy.
Competencies in the 21st century – the Singapore context
Over the last decade, there has been growing interest in the education community around the world in understanding the reasons behind Singaporean students’ performances in mathematics, science, and reading measured by international benchmark tests such as Trends in International Mathematics and Science Study (TIMSS), Progress in International Reading Literacy Study (PIRLS), and Program for International Student Assessment (PISA) (Bybee, 2007; Menon, 2000). In the 2011 TIMSS study, Singaporean Grade 4 and 8 students were ranked second and first in science, respectively (Ministry of Education 2013). In the 2012 PISA study, Singapore 15-year-old students outperformed their peers in other countries in science—ranking third in mean score achievements; second in percentage of top performers (22.7%), and 55th in percentage of low performers. Singapore, however, is also one of the highest ranked nations with a large difference in the top- and lowest performing (tenth percentile) students in all three subjects (Organization for Economic Co-operation and Development or OECD, 2012a, 2012b). More recently, increased effort has been channeled to levelling up the academic performance of its academically weaker students or lower track learners (Wang, Teng, & Tan, 2014). These efforts and achievements perhaps reflect Singapore’s strategic endeavor to develop a highly qualified workforce to attain a sustainable and lively economy in view of challenges posed by our shrinking and aging population and economic competition from neighboring countries. To help students thrive in this fast-changing world, it is paramount that they be well equipped with the necessary 21CC. Clearly, doing well academically is just one major aspect of the children’s holistic development. Much learning and mastery of many types of skills are needed in order to survive effectively in today’s world (e.g., thinking skills, communication skills, social and emotional competencies).
Making inferences in science
One such important 21CC is that of inference skill. Inference skill refers to the ability to engage in the process of reasoning the conclusions based upon available information or evidence that is implicit and not explicitly stated (Silver, Dewing, & Perini, 2012). This skill is particularly relevant to scientific understanding and investigations, and it is one major component of science process skills (National Research Council, 2011). Espoused in many countries’ science curriculum framework and syllabuses, inference skill is more cognitively demanding as compared to direct information recall. While students can be provided with information to memorize, science inference skills can only be developed through exposure to diverse cases, scenarios, and events requiring students to draw relevant contextual information and prior knowledge to explain the observed phenomena.
According to The Delphi Report (Facione, 1990), ‘inference’, one of the six cognitive skills in critical thinking, is defined as follow:
To identify and secure elements needed to draw reasonable conclusions; to form conjecture and hypotheses’ to consider relevant information and to educe the consequences flowing from data, statements, principles, evidence, judgments, beliefs, opinions, conceptions, descriptions, questions, or other forms of representation. (p. 9)
The three sub-skills of inference include querying evidence, conjecturing alternatives, and drawing conclusions (Facione, 1990). These skills in inference making are ubiquitous in our everyday lives and in science.
Science is essentially based on observations and inference (McComas & Olson, 1998; Schwartz, Lederman, & Crawford, 2004). When scientists collect data (evidence) and analyze them, they make observations and interpret the data to derive at inferences about a scientific phenomenon. As such, scientific knowledge—based upon observations gathered through direct and indirect human senses, and inferences that form the interpretations about the nature world—is created from human imaginations and logical reasoning (Abd-El-Khalick, Bell, & Lederman, 1998; Akerson & Hanuscin, 2007; Fouad, K. E., Masters, & Akerson, 2015; Schwartz et al., 2004). When new data are obtained and considered, the new inferences made may lead to changes in existing scientific knowledge. Hence, the ability to make inference is a key aspect of the nature of science; it results in creativity in the understanding of a phenomenon, and supports the idea that scientific knowledge is tentative, theory-laden, and biased (Abd-El-Khalick & Lederman, 2000; American Association for the Advancement of Science, 1990; National Research Council, 1996, 2011). For example, no one has seen a living dinosaur, but people believe in their existence one upon a time owing to the fossils found by archeologists and scientists. Based upon the observations of the bones collected and arranged to form a structure, scientists make inferences about how they may look like, or even behave. Nonetheless, ideas about dinosaurs are continually changing as new fossils are found and new inferences are made based upon direct and indirect evidence. Similarly, atoms cannot be observed directly and only indirect evidence is used to determine the structure of an atom (Abd-El-Khalick & Lederman, 2000).
In sum, inferences are informal, data-dependent, observer-dependent, and circumstantial (Ben-Zvi, 2006). Inference making has an important role in the construction of scientific knowledge. Hence, it is a skill espoused in science teaching and learning around the world, including Singapore, and they are being assessed in international benchmark tests, such as TIMSS and PISA.
Purpose of the study
In view of the increasing interests in developing 21CC in students, it is paramount that teachers are also equipped with assessment literacy or the knowledge to determine their students’ learning and development. Only then can teachers more accurately adjust their pedagogies to address the learning needs of students.
In Singapore, academically weaker students are typically placed in the Normal Academic (NA) and Normal Technical (NT) tracks after their Grade 6 national examinations (i.e., the Primary School Leaving Examinations or PSLE) (Tan, Teo, & Poon, 2016). The students in the Normal tracks comprise about 40% of each student cohort (Ministry of Education, 2018a). The remaining 60% of the students are assigned to the Express track (Ministry of Education, 2018a; Tan et al., 2016). In the science curriculum across the academic tracks and grade levels (from Grade 3 when formal science schooling begins), students are required to make inferences when provided with scientific information, which require them to read, interpret, distil, make sense, and apply to answer the items. Examples of such questions testing inference skills would include data-based questions with tables and/or diagrams such as graphs. Such inference-type questions are regarded as higher-order thinking questions because students need to locate the significant parts of the tables and diagrams to distill relevant information or evidence, and reorganize the raw data in an appropriate way to answer the question. Higher-order thinking questions have been given increasing weightage in assessments over the years (Teng, 2013). It is noted that while inference skills are encouraged as part of developing 21st Century skills in schools, there is no specific topic in science to teach inference skills. As such, the exposure to making science inference may vary from schools. With such emphasis on science inference skills, teachers need to be informed about ways to measure the skills, and interpret and use the results.
A review of the literature however reveals a dearth of research and insights on the development of science inference skills in students, especially the lower track learners. In view of this shortcoming, the purpose of this study is to investigate the learning and development of science inference skills in lower track students in Singapore schools. While science inference skills are normally taught to higher ability students, lower track students could be exposed to such skills in view of the demands of the changing educational climate in the 21st Century. By way of understanding the learning of the lower track students, the findings could provide insights for teachers in identifying strategies to address their students’ learning and development in science inference skills. This study is one of the few attempts in investigating science learning of lower track students in Singapore, and it offers different perspective as compared to those found in the PISA or TIMSS reports. This is because samples from those international studies involve students of mixed abilities.
More specifically, the aim of this study is to assess the natural learning growth of lower track students’ science inference skills. The term ‘natural growth’ refers to the students having undergone regular science instruction without any form of research intervention. It is also important to note that while teachers are encouraged to include the development of science inference skills, it is not explicitly incorporated into the structured science curriculum. Nevertheless, it is still important gain insights to the students’ learning of science inference skills, so that it may inform teaching strategies and approaches (e.g., create activities that challenge or support students’ science inference skills).
This study has two specific research questions:
-
1.
Would lower track students’ show significant learning growth in science inference skills over time (i.e., across the three tests).
-
2.
What types of science inference skills have students developed over time?
The findings to the first research question would provide an overview of the lower track students’ learning and development in science inference skills over time. Insights to students’ understanding over time and on how the skills are taught in Singapore schools may be drawn. Additionally, the findings could also provide answers to the second research question – that is, to what extent do students know how to apply those inference skills. More specifically, what types of skills have they mastered and which skills do they find most difficult. Again, these findings may have implications for teaching and learning practices.
Methodology
Sample
In total, 1397 Grade 7 NA students from 38 public and co-educational secondary schools in Singapore participated in the study. The focus of this study is on NA students and this sample represented approximately 15% of the Grade 7 NA student cohort in all Singapore government and government-aided schools (refer to Ministry of Education, 2015). While lower track students in Singapore may also include NT students, the syllabus is different from NA students. NT science curriculum is also more practice-oriented (Ministry of Education, 2018b). Only data collected from participants who completed all three testsFootnote 1 were included in the study. As a result, 293 (17.3%) participants were excluded from the sample. The students attended regular science lessons with a total duration of more than two-hours each week. All the students had taken science as a subject since Grade 3 (aged 9).
Instrumentation
Three tests (that is, Test 1, 2 and 3) were employed to determine the learning growth of students in their science inference skills. While science inference skills may involve a variation of skills, they are assumed to be a unidimensional construct in measuring students’ science inference skills. This assumption is reasonable as the aim is not to measure specific types of skills in making scientific inferences (refer to discussion on dimensionality issues in Tennant & Pallant, 2006). As there are no existing test instruments pertinent to the Singapore syllabus, the three tests were developed by a university expert faculty member from science education and reviewed by three faculty members from the same department. The expert and reviewers are all responsible for science teacher training. The expert is also very familiar with teaching Normal Academic (NA) track students, and assessing preservice teachers’ teaching in NA classrooms during practicum. All three reviewers have between 8 to 15 years of former teaching experiences in high school science education. The test items were mostly original, with some being adapted from other sources (e.g., from Science Achievement Tests from Alberta, Canada). The design of test items was based on several criteria, and they are:
-
a)
not having contextually-dependent knowledge or prior content knowledge,
-
b)
item presented in formats (e.g., food chain diagram, tables, graphs) that students are familiar with (i.e., they have been previously exposed to),
-
c)
the language was kept simple so that the students could understand the questions,
-
d)
included items with ranging difficulty levels for each test, and
-
e)
developed tests in increasingly difficulty levels (i.e., in terms of the complexity of the thought-processes, number of steps that needed to be taken to obtain the answer, and the amount of information that had to be distilled).
An example of the test item is provided in Table 1, to explain how a test item was modified to become more difficult in the subsequent test. To answer Test 1 Item 2, students have to extend beyond the length of the ruler to estimate the length or a curly hair. In Test 1 Item 1, students were not required extend or estimate, but instead read the values and take the difference in determining the length of the handprint.
Each test consisted of 15 multiple-choice items and were administered over one academic year. For test equating purposes, the items in the three science inference tests were designed to contain some repeated items between them. The test items and repeated items (in bold) are shown in Table 1. This is a necessary step in test equating so that students’ performances over the three tests (and over time) can be comparable. This process of equating used in this study is known as “common items equating” approach in which the items in the three tests are arranged into a single large matrix of persons by items, with the common items aligned in their respective columns in the data set. In this way, the three tests are equated in a single step calibration process (see Chong & Popp, 2005; Goh, Lee, & Hairon, 2017; Lee, 2003).
Administration of the science inference tests
Test 1, 2, and 3 were administered at the beginning of the academic year, after the mid-year examinations, and after the end-of-year examinations, respectively. This allowed observations of natural growth over the 9-month period (with a 3-month interval between the first two tests, and a 5-month interval between the second and third tests). The tests were administered using hardcopies, and the students were given 30-min during formal curriculum time or after school to complete each test. A teacher or researcher was present for each administration of the test to ensure that the students completed the task independently. Students were not allowed to leave the classroom before the time was up. The test results were used for the research study, and not taken into account in the students’ final school grading. Hence, participation was completely voluntary, and the consent to participation was obtained from all students and their parents prior to the conduct of the study. The students’ responses were tabulated by the researchers and analyzed.
Data analysis
Rasch analysis (Wright, 1993; Wright & Masters, 1982; Wright & Stone, 1979) is used for the determination of the measures of the students’ abilities in making science inferences (refer to Additional file 1). After performing Rasch analysis of Test 1, five items (i.e., Q4, 5, 8, 11, and 13) ranging with difficulty levels were selected to be repeated in Test 2. The same process was employed in the analysis of Test 2 results to identity items to be repeated in Test 3. This time, three items from Test 2 (i.e., Q2, 9, 14) and two items from Test 1 (i.e., the originally numbered Q7 and 9) were selected as repeated in Test 3. For this purpose, the items were renumbered in the later tests, but a detailed record was kept for the total number of test items. In all, there were 35 test items over the three tests. A single matrix Rasch analysis was performed on all 35 items and 4191 persons’ responses (i.e., 1397 students × 3 tests) calibrated onto a common scale. This calibration approach is a legitimate way of entering the data as each student would be a ‘different’ person (i.e., change in status in students’ ability level) in as far as science inference skills were concerned.
To validate the person and item measures, the fit statistics were examined (i.e., infit and outfit mean squares, standardized residuals, item discrimination, and item and separation reliabilities of the items and persons). Based on the guide provided by Wright and Linacre (1994), persons and items with: (1) infit and outfit mean squares greater than 2, and (2) large residuals, may be considered for removal. In our study reported in this paper, the analysis did not warrant the removal of any misfitting items or persons. In addition, an analysis of the outputs of the Principal Components Analysis (PCA) provided with the Winsteps 3.75.1 software program (Linacre & Wright, 2000), did not indicate concerns for multidimensionality in the science inference scale. The first contrast in the “unexplained variance” is less than 2, and only 3.1%. This is smaller than the variance explained by the item difficulties at 11.8%. The final step of the analysis involved deriving the students’ ability measures for the three respective tests by using item measures obtained from the single matrix calibrations as anchors. The outcome of the analysis is that all the items and persons are measured on the same scale in ‘logits’.
Results and discussion
The results from the Rasch analyses provided some interesting insights on the quality of the instruments in distinguishing the abilities of the learners, and how well the tests were targeted to the abilities of the cohort of lower track learners. In addition to determine students’ learning over time, it was also useful to examine the types of test items lower track students found easy and those they found difficult. By analyzing the location of the items on the Wright distribution maps, the nature of the test items was identified, and linked to the specific type of curriculum enacted in the lower track classrooms (e.g., lack of opportunities for students to design science experiments). These insights may be useful for teachers in evaluating their science lessons (e.g., whether the objectives of the science curriculum are met) and informing their future lesson planning.
Person and item separation reliabilities
The person separation reliability measure is used to classify people, in this case, students’ ability levels. The person separation reliability is 0.34. The further this measure is to 1 indicates that the students’ abilities in science inference skills were very homogeneous. In order words, there is not a sufficient spread in the students’ abilities. At the same time, the items separation reliability is 1.00 indicating that there was a good spread of ‘easy and difficult to agree to’ questions. The item separation reliability is a measure that indicated how well the items were separated to create an item difficulty hierarchy (refer to Table A in Additional file 1). A further examination of the Wright distribution map in Fig. 1 shows that the students’ (person) mean measure was slightly lower than the mean difficulty measure of the items, but close. This indicates that the test items were generally well targeted to the students mean abilities, however the students as a cohort were generally ‘weak’ in science inference skills.
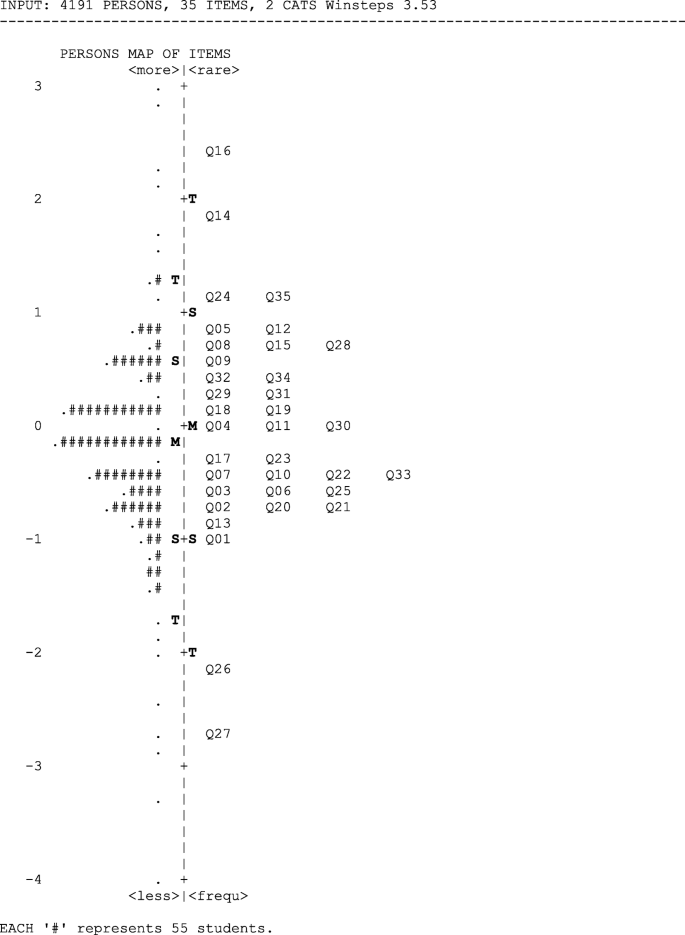
The Wright distribution map for 1397 Grade 7 NA students and 35 science inference test items
Wright distribution map
The Wright distribution map, depicted in Fig. 1, shows the calibrations of all 35 items and 4191 persons (i.e., 1397 students × 3 tests) onto a common scale measured in logits. The left side of the map depicts students’ ability measures in science inference skills, and on the right, are the difficulty measures of the 35 test items. The letters ‘M’ on either side of the map refer to the Person Mean measure and Item Mean measure respectively. The letters ‘S’ and ‘T’ on either side of the scale represent the first and second standard deviations of the respective measures. As noted earlier, the Persons’ Mean measure was slightly below the Item Mean difficulty, indicating that the students found the tests items somewhat difficult. Persons (i.e., the students) located on the same level as a test items would mean that the person has a 50% probability of obtaining the correct answer.
The two toughest questions
From Fig. 1, Q16 (refer to Table 1) was the most difficult for the students with almost 99% of their ability measures below the difficulty of this item. To get the correct answer, the students needed a considerable amount of skill that include reading a scale, relating to a real object, interpreting the diagram, making approximations, and extending from the given information. First, students had to decide whether to consider the length of the hair when wavy or stretched out. The majority of the students (or 58%) chose option B probably because they did not consider the part of the hair that lied outside the ruler. They had probably estimated its full length to be twice of 14 cm and hence, chose option B. If students had approximated the full length of the wavy hair (approximately 21 cm) and multiplied by two, it would be approximately 42 cm long.
Q14 (refer to Table 2) was the second most difficult item for students. Only a few students had greater than 50% probability in getting this question correct. One possible reason that most students got this item incorrect is because they interpreted the word ‘similar’ to mean ‘same’, and proceeded to identifying a complete match between the two sets of diagrams. The answer key was D, while most students chose C. Among the three statements (i.e., Statements I, II, and III), the first was probably the most distinct and students who did not try to identify a similar feature would think that Statement I was incorrect.
Challenging items located above the mean item difficulty
There were 19 items located above or on the Item mean difficulty (‘M’ on the right of the scale) (refer to Fig. 1). These were generally more difficult test questions. About 50% of the students found these questions difficult as their abilities were below the items’ measures. The difficulty of the items did not however correspond with the number of different skills needed to answer each item as some items contained a lot of information that students had to extract even though only one skill was required (e.g., Q35). Similarities among these items alluded to the science inference skills that students were lacking:
-
Experiments and variables: Q04, Q05, Q18, and Q32 were the only four items related to the design of experiments, dependent and independent variables, and reliability of measurements. All four items were found to be difficult.
-
Interpretations of diagrams and tables: Q09, Q11, Q12, Q14, Q16, Q18, Q19, Q24, Q28, Q30, Q31, Q32, Q34, and Q35 contain graphs, pictures, diagrams, or tables. Students had to interpret their non-textual information and draw out relevant information to answer the question. Among these items, Q14, Q16, Q24, and Q35 were at least one logit above the mean. Q18 and Q24 required students to extend beyond the presented information. Q09, Q30 and Q34 required students to combine the diagrammatic and textual information in the item stem. Q35 contained rich information that students had to extract from the flowchart. Q19 and Q31 required students to make associations between different abstract and alternative representations of atoms in molecule.
-
Extend from given information: Q16, Q18, and Q24 required students to extend beyond what was given in the item to make approximations (Q16 and Q18) or recognize pattern change (Q24).
-
Deduce by logical elimination: The answers to Q14, Q29, and Q32 could be deduced by logically eliminating the distractor options (Q14 and Q32) or identifying the unique/odd information in the item stem (Q29).
More manageable items located below the mean item difficulty
There were 16 items located below the item mean difficulty (‘M’ on the right of the scale). These were generally easier test questions. Again, about 50% of the students’ abilities were above the items’ measures. Similarities among these items alluded to the science inference skills that students possessed:
-
Pattern change recognition: Q23, Q25, and Q33 could be answered by recognizing the change in patterns.
-
Identify answer that lies in a range: All three items (Q06, Q13, and Q23) that could be answered using range were found to be easy for students.
-
Apply given science concept: For Q02 and Q17, a scientific concept was given to students. They could apply the concept to explain the observed phenomena.
-
Direct interpretation/simple manipulation of limited information from diagrams and tables with less information: Q01, Q03, Q07, Q10, Q13, Q21, Q22, Q26, and Q27 involved simple calculations and/or interpreting diagrams/graphs/textual data with limited information. As compared to Q19, Q03 had fewer abstract representations and hence, students found the latter to be easier.
The easiest questions
The easiest test questions were Q27 and Q26, with possibly all students’ abilities above the measures of these two items. Q27 was the easiest item followed by Q26. To answer Q26, students had to look through each diagram and identify the photograph that showed sharp teeth, which was most obvious in A. To answer Q27, students had to look through each diagram and identify the label related to chemical safety. Only C was related to lab safety with respect to how chemicals should be handled. The two items and skills needed to answer these items correctly are depicted in Table 3. It is not difficult to see why students found these items easy, as they only had limited information in the item stem and required to identify the correct answer that fitted one criterion.
Items that require an understanding of graphs
There were five items on understanding of graphs (i.e., Q09, Q12, Q22, Q24, and Q30; refer to Table 4). Three of them were located above the item mean difficulty (i.e., Q24, Q12, and Q09), while items Q30 and Q22 were located below the item mean difficulty (refer to Fig. 1). Q24 required students to recognize patterns and extend beyond the drawn curve to derive the answer. Students had to recognize the repeating pattern that the peak reached a maximum once every 10 years. They had to extend the curve to 2011 (beyond the graph) before the four peaks were observed.
Q12 and Q09 involved the interpretations of more than one curve and hence, students had to manage more information. To answer Q12, students had to take the maximum difference for each line. The curve with the smallest difference was the organism least affected by temperature changes. To answer Q09, students had to use the given information that polluted water contains less dissolved oxygen than unpolluted water. Y must be polluted since the curve was lower than P.
On the other hand, Q30 and Q22 had only one line in the graph, and answers could be directly obtained by identifying one value in the graph or performing a simple subtraction of two respective values to derive at the answer. For Q30, the original pH could be obtained from the sample when nothing was added to the acid. When the volume of P was 0 ml, the pH was 3. In Q22, to find out the growth of the plant between Week 2 and 8, the students should take the difference in the height of the plant at the respective weeks.
Comparing students’ Rasch measures and raw scores
The findings from this study have provided support for the view that the use of Rasch linearized measures instead of raw scores can provide more meaningful and accurate comparisons and hence, better understanding of student performance. These comparisons include both: (1) between individual students in a single test administration, and (2) between two different time points for the same student (Goh, Lee & Hairon, 2017). Teachers continue to use raw scores (mainly in the form of “percent correct”) to interpret and report on student performances as well as student growth because the need for simplicity and would appear to be logical assumptions for them to make, although erroneous. Taking the example of the analysis of the Test 1 (i.e., first 15 MCQ test items – refer to Table B in the Additional file 1), the idea that a score of 14 out of 15 is one mark more than 13 is no different from a score of 10 being one mark more than 9, may lead teachers to conclude that the additional one mark in the two case represent equal student effort. Clearly, this does not reflect the true difference in abilities as we were assuming that all test items had the same difficulty levels. The results showed that the persons (i.e., students’) measures on the tests are different from their raw scores.
Interpreting learning ‘growth’ in science inference skills
Generally, teachers do not have problems with test planning. However, their interpretations of student performances are often made without much consideration of the accuracy of “comparisons” between students’ performances. As noted in earlier, teachers continue to make comparisons of students’ performances without regard for scale linearity (i.e., erroneously treating raw scores as linear) and differences in test difficulty levels given at different time points (e.g., Test 1, Test 2 and Test 3). A single-step equating of the tests using Rasch analysis had put the three tests onto a common scale, thus enabling meaningful comparisons of student ability measures and hence, their performances across the different tests. For this purpose, a repeated ANOVA was used to compare the test equated students’ performance measures on the three tests (refer to Table C in Additional file 1). The Mauchly’s Test of Sphericity indicates that the variances of the student groups over time could not be assumed to be equal. As such, the Greenhouse-Geisser correction was used. The Tests of Within-Subjects Effects table showed that students’ test performances were significantly different over time [F (1.967, 1417.160) = 10.175, p < 0.01]. The Bonferroni correction is a multiple-pairwise comparison post-hoc test. It is useful in confirming where the significant differences occurred between groups and helps reduce the chance of Type 1 errors as a result performing many independent pairwise comparisons between groups. The Bonferroni post hoc test showed significant ‘declines’ (p < 0.01) in student test performances:
-
a)
From Test 1 (M = -.151, SD = .753) to Test 3 (−.290, SD = .773). All measurement in logits.
-
b)
From Test 2 (M = -.137, SD = .772) to Test 3 (M = -.290, SD = .773). All measurement in logits.
-
c)
There was no significant difference between Test 1 and Test 2 at p < 0.05.
The term ‘decline’ is used to denote the significant lower levels in students’ abilities in science inference skills over time. It is generally odd to describe students as declining in abilities. On the contrary, this observed ‘decline’ could be because of the lack of science curricular opportunities for engaging inference skills.
Discussion
The findings from this study have provided some interesting insights on Grade 7 lower track students’ learning and development of science inference skills in Singapore. First, the results show that the students’ science inference skills become significantly lower over time. As noted earlier, this observation may be due the lack of explicit integration and opportunities to apply inference skills in the Grade 7 NA science curriculum. The reality is that it is often a challenge for teachers to address more immediate concerns in covering all the content in the syllabus and preparing students for test-taking, than considering how to address longer term goals about how to prepare 21CC learners. Hence, it could have been that less curriculum time was spent on activities that promoted inferential thinking. This assertion is however, not surprising. There seems to be a view that when teaching lower track students, emphasis should be placed on lower-level cognitive skills (e.g., knowledge and understanding of the Bloom’s Taxonomy) rather than on inference skills (c.f., Teo, Yeo, & Tan, 2018; Zohar, Degani, & Vaaknin, 2001).
The results of the study showed that the students experienced greater difficulty with items that contained rich data presented in graphs, tables, diagrams, or charts, or required them to extend their thinking beyond the given information. This suggests that they had difficulty dealing with abstract or complex information because students had to decipher what was relevant to answer the item correctly. They had to distill the information and infer beyond the given information. It is indeed not easy for students, across all ages, to interpret such inscriptions (Bowen & Roth, 2002; Leinhardt, Zaslavsky, & Stein, 1990; Schnotz, 1993). This suggests that teachers should provide opportunities for students to be exposed to information-rich items such as data response items embedded in graphs, diagrams, tables, and charts. Students should also learn to ‘find’ answers beyond the presented information and draw inferences from them.
Students also had difficulty in deducing answers using the elimination technique or by logic. This would mean formulating justifications in the selection of the most plausible answers to the questions. While it is important for students to acquire good content knowledge and understanding, they should also be equipped with assessment literacy (e.g., skills in answering multiple-choice items) as they are required to sit for two national examinations at the end of the fourth (General Certificate of Education Normal level examinations) and fifth (General Certificate of Education Ordinary level examinations) year of secondary education. The results also showed that students experienced greater difficulty with items involving experimental design, setup, and identification of dependent and independent variables. This could be due to the students’ limited experience in designing, planning, and conducting experiments in the NA curriculum. In fact, most practical work that Grade 7 NA students did are confirmatory-type experiments with known expected answers and prescribed procedures. Hence, this could attribute to their lower competency in handling science inference items involving experiments. Items that involved pattern recognition, concluding using range, application of a given concept, and limited information were easier for the students possibly because they did not have to provide an exact answer and the limited scope made it easier for them to identify the relevant information to answer the item correctly.
Conclusion and implications of study
The findings from this study have not only provided some interesting insights to lower track students’ learning and development in science inference skills, but more importantly, they may have implications for science instruction, and teacher education.
From the discussion, teachers teaching lower track students can consider constructing diverse items—for practice worksheets, tests, or examinations—that include the different types of inscriptions (e.g., graphs, diagrams, charts, and so on) so that students are exposed to the variety of items. Emphasis on higher order thinking skills can bring out greater achievement outcomes for lower achievers as compared to higher achievers (Zohar & Dori, 2009). These items need not be stand-a-lone questions but incorporated into a science laboratory task that require students to design an experiment. In doing this, students will have to make decisions about the dependent and independent variables for the experimental and control groups. As the results from the analysis of the graphs have alluded, science teachers may wish to begin with simpler inscriptions and gradually use more complex inscriptions as this is in accordance to the progressive difficulty observed among the five graph items. Affording science laboratory experiences with a structured and targeted focus on developing students’ science inference skills, may well contribute to the broader efforts to level-up the lower track students and help to address concerns about achievement gaps.
Returning to the point about developing teachers’ assessment literacy, the insightful findings derived from the Rasch analysis suggests that there may be some significant value in teaching teachers this analytic approach so that they can find out specific areas of students’ learning that need to be honed. In summary, the benefits of using Rasch calibration rather than the traditional raw scores can be categorized are elaborated below.
First, most teachers are adept with using descriptive statistics (such as means, modes, and median) to analyze students’ test scores. However, as discussed earlier, using raw scores may have limitations in truly understanding student abilities, learning and development. In this paper, we demonstrated how Rasch modeling can be a useful analytical approach for teachers to use in assessing students’ true abilities and determining growth in learning through test equating. It is unfortunate that very few educators are knowledgeable about and adept in using this technique for understanding their student learning.
Second, the findings may be useful in informing teachers about the quality of the test instruments and how to improve it for future assessment. Rasch analysis can be used to validate the test items. While the fit statistics from the Rasch analysis show that the tests were well constructed, it could have been better targeted (in terms of ability levels) for the Grade 7 NA students. As noted earlier, the tests were deliberately designed to include different difficulty levels (i.e., easy, moderate, and difficult) within each test, and progressively more difficult across tests. Interestingly, the Wright Distribution Map indicates that there may still be room for improvement, particularly easier and tougher items.
Third, equipped with these insights from the present study, teachers can more accurately understand student learning. For instance, by way of examining the residuals from the Rasch outputs, the teachers may gain insights on whether students were careless and getting the items incorrect, or guessed and get the items correct. The results are also useful for teachers wanting to better understand students’ abilities at the extreme ends — that is, how to level up lower ability students, or stretch the learning of higher ability students. With such sharper resolution in the teachers’ understanding on how their students learn, teachers can be better equipped to decide on appropriate teaching pedagogies for classroom teaching and help improve in their students’ learning and development.
Availability of data and materials
The datasets used and/or analysed during the current study are available from the corresponding author on reasonable request.
Notes
Only selected items from the tests are discussed in this paper. Copies of the tests are available upon request from the corresponding author.
Abbreviations
- 21CC:
-
21st Century Competencies
- NA:
-
Normal Academic
- NT:
-
Normal Technical
- PCA:
-
Principal Components Analysis
- PIRLS:
-
Progress in International Reading Literacy Study
- PISA:
-
Program for International Student Assessment
- PSLE:
-
Primary School Leaving Examinations
- STEM:
-
Science, technology, engineering, and mathematics
- TIMSS:
-
Trends in International Mathematics and Science Study
References
Abd-El-Khalick, F., Bell, R. L., & Lederman, N. G. (1998). The nature of science and instructional practice: Making the unnatural natural. Science Education, 82, 417–436.
Abd-El-Khalick, F., & Lederman, N.G. (2000). The inuence of history of science courses on students’ views of nature of science. Journal of Research in Science Teaching, 37, 1057–1095.
Akerson, V. L. & Hanuscin, D. L. (2007). Teaching nature of science through inquiry: Results of a 3-year professional development program. Journal of Research in Science Teaching, 44(5):653–80.
American Association for the Advancement of Science. (1990). Science for all Americans. New York: Oxford University Press.
Bachen, C. M., Hernández-Ramos, P. F., & Raphael, C. (2012). Simulating REAL LIVES: Promoting global empathy and interest in learning through simulation games. Simulation and Gaming, 43(4), 437–460.
Ben-Zvi, D. (2006). Scaffolding students’ informal inference and argumentation. Retrieved on 16 Oct 2015 from https://iase-web.org/documents/papers/icots7/2D1_BENZ.pdf
Black, P., & Wiliam, D. (1998). Inside the black box-raising standards through classroom assessment. Phi Delta Kappan, 80, 139–148.
Boud, D., & Falchikov, N. (2006). Aligning assessment with long-term learning. Assessment and Evaluation in Higher Education, 31, 399–413.
Bowen, G. M., & Roth, W.-M. (2002). Why students may not learn to interpret scientific inscriptions. Research in Science Education, 32(3), 303–327.
Bybee, R.W. (2007). Science teaching and international assessments: An introduction to PISA and TIMSS. The Science Teacher, 74(8):41–48.
Chong, H. Y., & Popp, S. O. (2005). Test equating by common items and common subjects: Concepts and applications. Concepts and Applications. Retrieved on 4 July 2019 from https://pareonline.net/getvn.asp?v=10&n=4
Conklin, W., & Williams, R. B. (2011). Higher-order thinking skills to develop 21st century learners. California: Shell Educational Publishing, Inc.
Facione, P. A. (1990). Critical thinking: A statement of expert consensus for purposes of educational assessment and instruction: Executive summary of “the Delphi report”. Millbrae: The California Academic Press.
Fouad, K. E., Masters, H., & Akerson, V. L. (2015). Using history of science to teach nature of science to elementary students. Science & Education, 24(9–10):1103–1140.
Goh, J. W. P., Lee, O. K., & Hairon, S. (2017). Assessing students’ growth in mathematics and English language in Singapore: The practice, the evidence and the perceptions. In M. Y. Eryaman & B. Schneider (Eds.), Evidence-based and evidence-informed educational policy, research and practice for the public good [Series title: Educational governance research] (pp. 97–123). Switzerland: Springer International Publishing.
Griffin, P., & Care, E. (2015). Assessment and teaching of 21 st century skills. The Netherlands: Springer.
Koenig, J. A. (2011). Assessing 21st century skills: Summary of a workshop. Washington, DC: National Academies Press.
Lee, O. K. (2003). Rasch simultaneous vertical equating for measuring reading growth. Journal of Applied Measurement, 4(1), 10–23.
Leinhardt, G., Zaslavsky, O., & Stein, M. K. (1990). Functions, graphs, and graphing: Tasks, learning, and teaching. Review of Educational Research, 60, 1–64.
Linacre, J. M., & Wright, B. D. (2000). WINSTEPS: Multiple-choice, rating scale, and partial credit Rasch analysis [computer software]. Chicago MESA Press.
McComas, W. F., & Olson, J. K. (1998). The nature of science in international science education standards documents. In W. F. McComas (Ed.), The nature of science in science education: Rationales and strategies (pp. 41–52). Dordrecht: Kluwer.
Ministry of Education (2013). International Studies Affirm Singapore Students' Strengths in Reading, Mathematics & Science. Retrieved on 4 July 2019 from https://www.schoolbag.sg/story/international-studies-affirm-singapore-students%27-strength-in-reading-mathematics-science
Ministry of Education (2015). Education statistics digest 2015. Retrieved on 20 Oct 2016 from https://www.moe.gov.sg/docs/default-source/document/publications/education-statistics-digest/esd-2015.pdf
Ministry of Education (2018a). Education statistics digest 2018. Retrieved on 27 Mar 2019 from https://www.moe.gov.sg/docs/default-source/document/publications/education-statistics-digest/esd_2018.pdf
Ministry of Education (2018b). Changes affecting normal course. Retrieved on 27 Mar 2019 from https://www.moe.gov.sg/education/secondary/normal-course-curriculum/changes-affecting-normal-course
Menon, R. (2000). Should the United States emulate Singapore’s education system to achieve Singapore’s success in TIMSS? Mathematics Teaching in the Middle School, 5, 345–347.
National Research Council. (1996). National science education standards. Washington, DC: National Academic Press.
National Research Council. (2011). A framework for K-12 science education. Washington, DC: National Academic Press.
OECD (2012a). Program for International Student Assessment (PISA) - Results from PISA 2012 problem solving: Singapore. Retrieved on 4 July 2019, Singapore from http://www.oecd.org/countries/singapore/PISA-2012-PS-results-eng-SINGAPORE.pdf
OECD (2012b). Singapore: Student performance. Retrieved on 4 July 2019, from http://gpseducation.oecd.org/CountryProfile?primaryCountry=SGP&treshold=10&topic=PI
Ratcliffe, M. (1999). Evaluation o-f abilities in interpreting media reports of scientific research. International Journal of Science Education, 21, 1085–1099.
Schnotz, W. (1993). Introduction. Learning and Instruction, 3, 151–155.
Schwartz, R. S., Lederman, N. G., & Crawford, B. A. (2004). Developing views of nature of science in an authentic context: An explicit approach to bridging the gap between nature of science and scientific inquiry. Science Education, 88(4):610–45.
Shepard, L. A., Hammerness, K., Darling-Hammond, L., Rust, F., Snowden, J. B., Gordon, E., Gutierrez, C., & Pacheco, A. (2005). In L. Darling-Hammond & J. Bransford (Eds.), Preparing teachers for a changing world: What teachers should learn and be able to do (pp. 275–325). San Francisco: Wiley.
Silver, H. F., Dewing, R. T., & Perini, M. J. (2012). Inference: Teaching students to develop hypotheses, evaluate evidence, and draw logical conclusions. Alexandria: ASCD.
Soland, J., Hamilton, L. S., & Stecher, B. M. (2013). Measuring 21st century competencies: Guidance for educators, a global cities education network report (pp. 1–70).
Stiggins, R. J. (2002). Assessment crisis: The absence of assessment for learning. Phi Delta Kappan, 83(10):758–65. https://doi.org/10.1177/003172170208301010
Tan, K. C. D., Teo, T. W., & Poon, C.-L. (2016). Singapore science education. In M.-H. Chiu (Ed.), Science education research and practice in Asia: Challenges and opportunities (pp. 155–174). Singapore: Springer.
Teng, A. (2013). ‘Interesting, tricky’ PSLE science paper scores well with parents. Retrieved on 19 Oct 2016 from http://www.straitstimes.com/singapore/interesting-tricky-psle-science-paper-scores-well-with-parents.
Tennant, A., & Pallant, J. F. (2006). Unidimensionality matters! (A tale of two Smiths?). Rasch Measurement Transaction, 20(1), 1048–1051.
Wang, L. Y., Teng, S. S., & Tan, C. S. (2014). Levelling up academically low progress students (NIE working paper series no. 3). Singapore: National Institute of Education.
Wright, B. D. (1993). Logits? Rasch Measurement Transactions, 7(2), 288.
Wright, B. D., & Linacre, J. M. (1994). Reasonable mean-square fit values. Rasch Measurement Transactions, 8(3), 370.
Wright, B. D., & Masters, G. (1982). Rating scale analysis. Chicago: MESA Press.
Wright, B. D., & Stone, M. H. (1979). Best test design. Chicago: MESA Press.
Zohar, A., Degani, A., & Vaaknin, E. (2001). Teachers’ beliefs about low achieving students and higher order thinking. Teaching and Teacher Education, 17(4), 469–485.
Zohar, A., & Dori, Y. J. (2009). Higher order thinking skills and low-achieving students: Are they mutually exclusive? Journal of the Learning Sciences, 12(2), 145–181. https://doi.org/10.1207/S15327809JLS1202_1.
Acknowledgements
We would like to thank Khin Muang Aye for assisting in the analysis of this paper.
Funding
This study was funded by Singapore Ministry of Education (MOE) under the Education Research Funding Programme (OER 51/12 TWT) and administered by National Institute of Education (NIE), Nanyang Technological University, Singapore. Any opinions, findings, and conclusions or recommendations expressed in this material are those of the author(s) and do not necessarily reflect the views of the Singapore MOE and NIE.
Author information
Authors and Affiliations
Contributions
TWT directed the study and prepared most parts of the manuscript draft. WPJG advised on the data analysis and wrote the methodology section. Both authors read and approved the final manuscript.
Authors’ information
Tang Wee Teo (PhD) is an Associate Professor at the Natural Sciences and Science Education Academic Group, National Institute of Education (NIE), Nanyang Technological University, Singapore. She is also the Co-Head of the Multi-centric Education Research and Industry STEM Centre at NIE (meriSTEM@NIE). She is an equity scholar in science and STEM education. Currently, she serves as an editorial board member of the journals Asia-Pacific Science Education, Pedagogies: An International Journal and Asian Women.
Jonathan WP Goh (PhD) is an Associate Professor at the Policy and Leadership Studies Academic Group, National Institute of Education, Nanyang Technological University, Singapore. He obtained a first class honors degree in Commerce from Murdoch University in 1994, and a PhD (with Distinction) in Marketing from the University of Western Australia in 2001. Dr. Goh teaches research methodology, educational marketing and school leadership-related courses in various professional development and graduate programs. His teaching and research interests include research methods, student learning and assessment, measurement (including Rasch analysis, hierarchical linear modeling and structural equation modeling), educational marketing, and cross-cultural aspects in leadership and management. His works have been published in the International Journal of Educational Research, Educational Research, Higher Education, International Journal of Leadership in Education, and School Leadership and Management, and Educational Management, Administration and Leadership.
Corresponding author
Ethics declarations
Competing interests
The authors declare that they have no competing interests.
Additional information
Publisher’s Note
Springer Nature remains neutral with regard to jurisdictional claims in published maps and institutional affiliations.
Additional file
Additional file 1:
Elaborations and relevant data. (DOCX 30 kb)
Rights and permissions
Open Access This article is distributed under the terms of the Creative Commons Attribution 4.0 International License (http://creativecommons.org/licenses/by/4.0/), which permits unrestricted use, distribution, and reproduction in any medium, provided you give appropriate credit to the original author(s) and the source, provide a link to the Creative Commons license, and indicate if changes were made.
About this article

Cite this article
Teo, T.W., Goh, W.P.J. Assessing lower track students’ learning in science inference skills in Singapore. Asia Pac. Sci. Educ. 5, 5 (2019). https://doi.org/10.1186/s41029-019-0033-z
Received:
Accepted:
Published:
DOI: https://doi.org/10.1186/s41029-019-0033-z